


IF YOU'RE RESPONSIBLE FOR CREATING A MONTHLY DIGITAL MARKETING REPORT BUT FEEL UNSURE ABOUT WHAT TO INCLUDE, READ THIS.
When we create digital marketing reports for internal use and evaluation, these are the specific elements we include: website and paid ad analytics, social media stats, a list of work accomplished, and a general summary. This information is useful for gauging success and identifying areas that need improvement.
1. Website Analytics
Like most digital marketers, we rely on Google Analytics. It's robust and offers tons of information. However, not all the information is useful to everyone. We look at the below metrics with month-over-month and year-over-year comparisons. This helps to keep an eye on trends and growth. Below is what we decided to use for our monthly reports.
- Sessions: The number of times that people came to your website.
- New Users: The number of visitors who came to your website for the first time or without a Google cookie from their last visit.
- Pages/Session: The number of pages on your website that the average visitor has accessed.
- Average Session Duration: The average length of visitors’ sessions.
- Sessions & New Users by Channels: This overview metric includes organic and paid search, plus direct, referral, and social traffic.
- Sessions & New Users by Social Network: This metric show traffic coming from specific social channels like Facebook, Twitter, Instagram, Pinterest, LinkedIn, etc.
- Sessions by Landing Page: These are the top website pages that visitors land on first.
- Goal Destination Completions: This measures how often users complete specific actions or visit a certain page.
TIP: Did you know that you can create and export custom Google Analytics reports? Sure can!
In addition to Google Analytics, we also lean heavily on HubSpot's reporting tools. Just like with Google Analytics, we can create custom reports. It's helpful to compare the data between both platforms.
2. Social Media Analytics
Choose your top three social channels and report on them. You could do more, but usually three is a fair number for solid assessment. We often focus on Facebook, Twitter, and Pinterest. This provides a glimpse into how people are interacting and engaging with the brand.
NOTE: Don't get caught up in the numbers below; these are for example only.
You can take a snapshot of Insights (Example A), create a custom chart (Example B), or use bullet points (Example C).
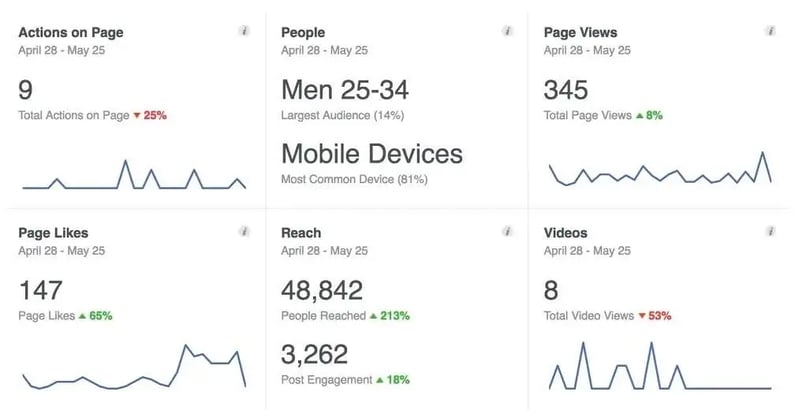
Example A: Snapshot of Insights
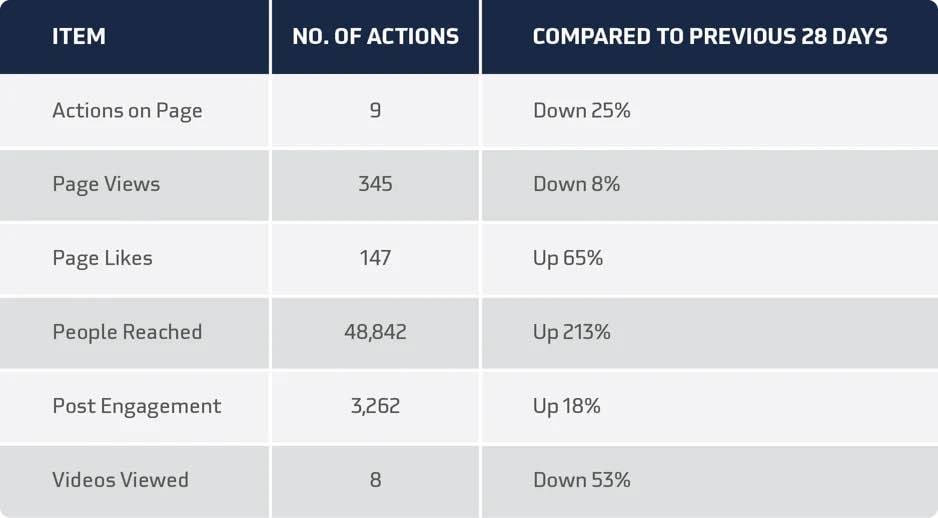
Example B: Custom chart
Example C: Bullet points
- Actions on Page: 9 | Down 25% compared to previous 28 days
- Page Views: 345 | Down 8% compared to previous 28 days
- Page Likes: 147 | Up 65% compared to previous 28 days
- People Reached: 44,842 | Up 213% compared to previous 28 days
- Post Engagement: 3,262 | Up 18% compared to previous 28 days
- Video Views: 8 | Down 53% compared to previous 28 days
You can take a snapshot of the native analytics chart (Example A), create a custom chart (Example B), or use bullet points (Example C).
Example A: Snapshot of native analytics chart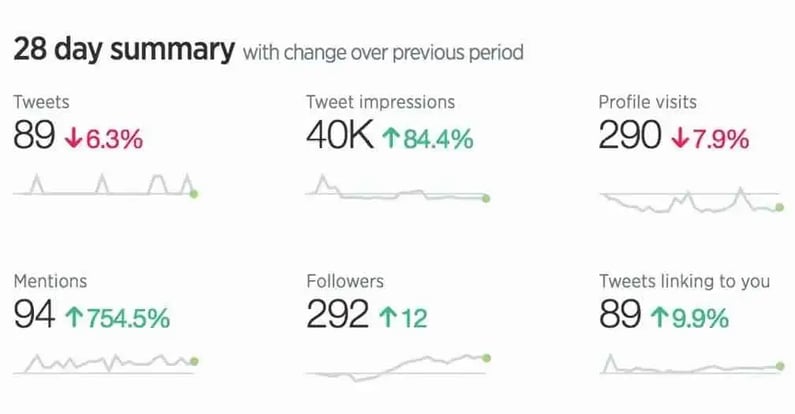
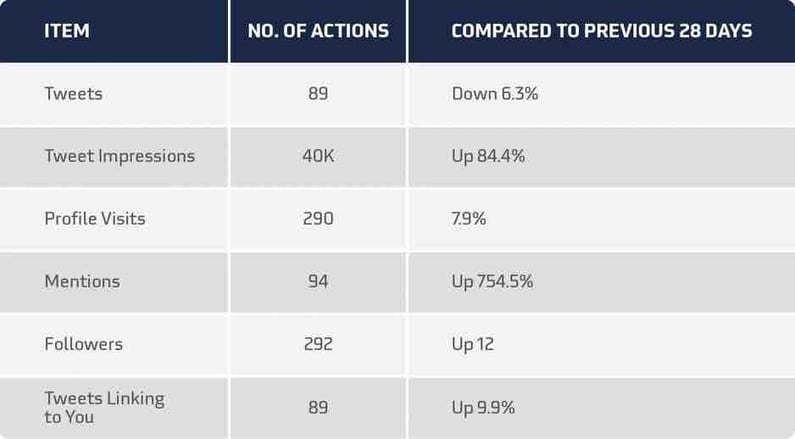
Example B: Custom chart
Example C: Bullet points
- Tweets: 89 | Down 6.3% compared to previous 28 days
- Tweet Impressions: 40K | Up 84.4% compared to previous 28 days
- Profile Visits: 290 | Down 7.9% compared to previous 28 days
- Mentions: 94 | Up 754.5% compared to previous 28 days
- Followers: 292 | Up 12 compared to previous 28 days
- Tweets Linking To You: 879| Up 9.9% compared to previous 28 days
You can take a snapshot of the native analytics chart (Example A), create a custom chart (Example B), or use bullet points (Example C).
Example A: Snapshot of native analytics charts
Example B: Custom chart
Example C: Bullet points
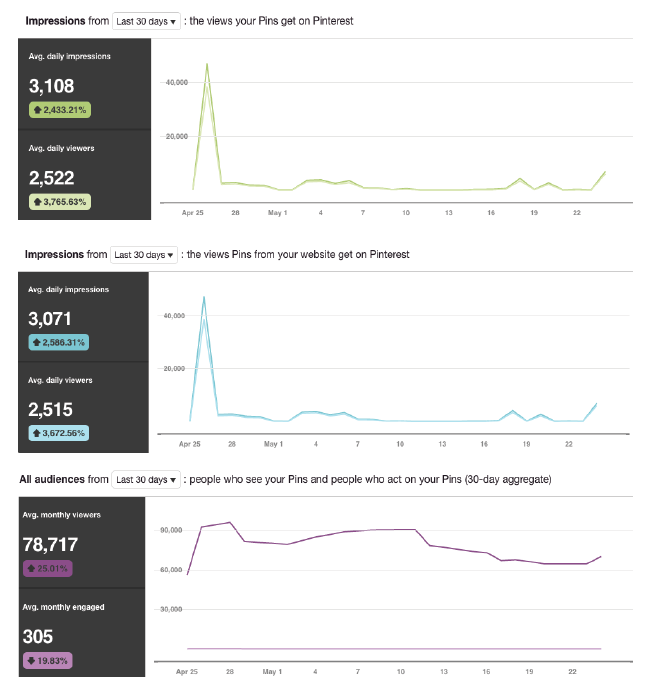
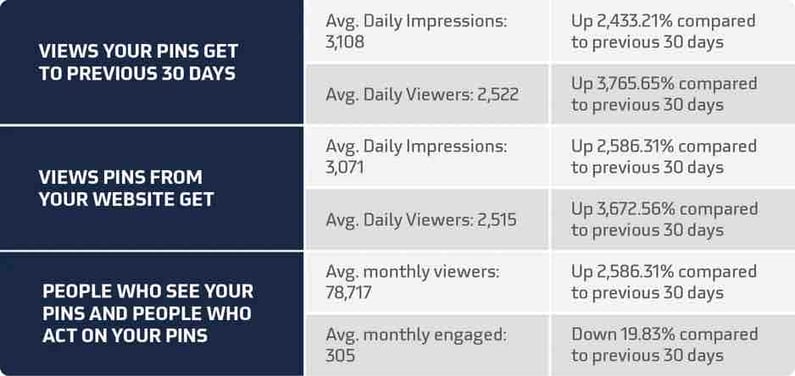
Views your Pins get
- Avg. Daily Impressions: 3,108 | Up 2,433.21% compared to previous 30 days
- Avg. Daily Viewers: 2,522 | Up 3,765.65% compared to previous 30 days
Views Pins from your website get
- Avg. Daily Impressions: 3,071 | Up 2,586.31% compared to previous 30 days
- Avg. Daily Viewers: 2,515 | Up 3,672.56% compared to previous 30 days
People who see your Pins and people who act on your Pins
- Avg. monthly viewers: 78,717 | Up 25.01% compared to previous 30 days
- Avg. monthly engaged: 305 | Up 19.83% compared to previous 30 days
3. Work Done
Did you work on website development, design some collateral, launch a campaign, or create a content offer? Here's the place to list specific items along with a brief description and initial data.
Example:
Below are the tasks that our team accomplished this month.
- Completed 50% of the planned site content audit; an audit report will be ready next month
- Published 2 new blog posts and added them to LinkedIn and Medium; already at 400 views, 10 CTA click-throughs, and 2 new contacts
- Posted a giveaway on Facebook that earned over 20% the average engagement rate
- Published over 40 actions on 3 social media platforms; total engagement is around 15%
4. Summary
We use this portion to sum up ways in which our efforts are contributing to the overall marketing plan, goals, and in short, what return on investment was garnered that month. One succinct paragraph is sufficient.
Example:
This month our marketing efforts lead to a 5% increase in website traffic, 6% increase in social media interactions, and 5 new contacts. We believe these actions contributed to this month's sales goals being exceeded by 10%.
And there you have it — a monthly marketing report that's pretty straightforward and easy to track from month to month.
While this report is perfect for digital marketers and marketing departments, often decision-makers, business owners, and board members want a big picture report on how marketing efforts are performing and influencing the bottom line.
For more ideas on creating Monthly Marketing Reports, check out these sources:
- The 7 Slides You Need for an Epic Monthly Marketing Report
- Top 10 Items to Include in a Monthly Marketing Report
- 10 Sample Marketing Report Templates
If you could use help strategizing and implementing digital marketing efforts (including creating monthly digital marketing reports!), we'd love to help. Browse our services or give us a shout!