


When goal-setting, you need a way to measure where you’ve been and forecast where you're going.
I can't tell you how many business owners have a revenue goal in mind, but those goals slip away year after year because they don't have a systematic plan to reach them.
We understand that looking at the big picture can be overwhelming. After all, where do you start? Instead of allocating a budget to things that may or may not get you the results you need, we have found that evaluating your goals and breaking them down first will help point you in the right direction.
When you're working towards a goal, you want to have a way to measure the progress you've made. But what if you could use that information as an indicator for future success or a predictor for reaching your goals?
I often find the challenge with reporting is that it only shows what happened in the past but can't forecast what's to come. That's where leading indicators come into play.
What Are Leading Vs Lagging Indicators?
There are two ways to measure goals — with lagging and leading indicators.
Lagging indicators are financial signs that become apparent only after a large shift has taken place. That's why lagging indicators are great for confirming long-term trends but not predicting them. The key here is that they confirm what has already happened. While this is the most common way to look at indicators, it can be frustrating for those who want to predict what's coming next.
On the other hand, leading indicators are any measurable or observable variable of interest that predicts a change or movement in another data series, process, trend, or other phenomena of interest before it occurs. This means that leading indicators help us predict what we think will happen based on changes that have happened. These help us know if we are on the right track when trying to reach a long-term goal.
I’m not saying that lagging indicators are not important because they are. I think it's using them together that’s the most powerful.
For instance, if we look at overall leads that visit a website, and we know our buying cycle is three months and our sales conversion rate is 50%, we can reasonably predict what our sales will be in three months. This gives us the power to move levers up or down based on how happy we are with those sales numbers. Now, this is a pretty basic example. There will often be additional complexities like seasonality, etc., so you have to take those into consideration, but you get the idea.
When we work with leading indicators, we look at them around marketing, sales, and service — each department leading into the next. Marketing driving leads to sales; the more sales we have, the more likely we need service. We generally start with a breakdown like this:
- Website Traffic > Conversion Rate
- Leads > Conversion Rate
- Sales > Conversion Rate
- Service
By taking your original goals and dropping them into these buckets, you can start to see estimated numbers for your year. For example, here's what it would look like if we were trying to predict total revenue for the year:
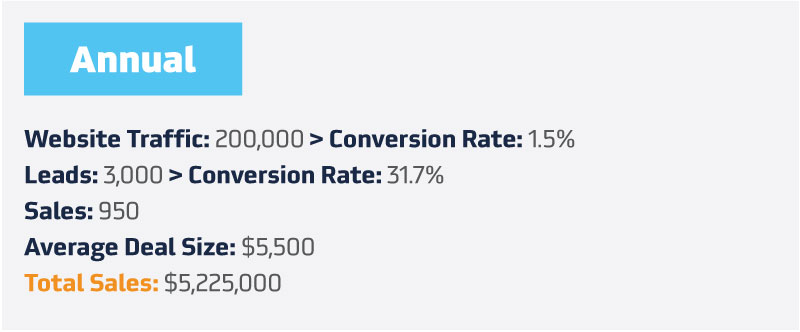
From here, we can break down this information to know where we should be each month to ensure we’re on track to reach our goals.
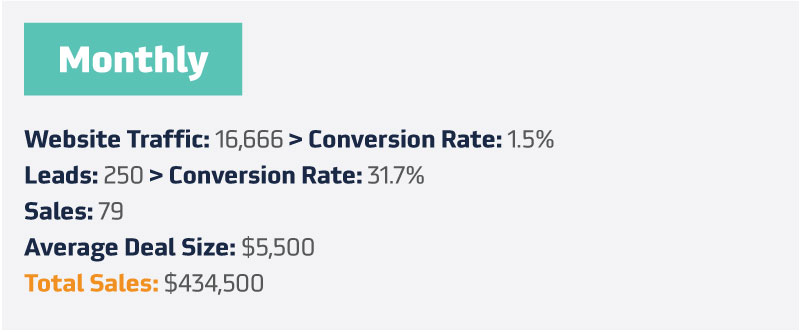
By following this model, you should know each month if you're hitting your numbers and if your conversion rate is on target. If not, adjustments need to be made.
If you've never calculated these types of numbers before, it's often helpful to look at the previous year for reference. You can do this by pulling your annual numbers from the year before. I usually start with total sales, average deal size, and total deals closed, then go to website traffic and leads. From there, you can calculate the conversion rate by taking the smaller number and dividing it by the bigger number:
Leads/traffic = Conversion rate for traffic to leads
Once you have this historical look at your numbers, you'll have a better idea of what to input for the next year or month (or whatever unit you are measuring).
We use a % change calculation. This helps us to be realistic as we set our goals. For instance, going from 5.2M to 8M sounds great, but that's a 53% increase from the previous year. Here’s what that would look like, practically speaking.
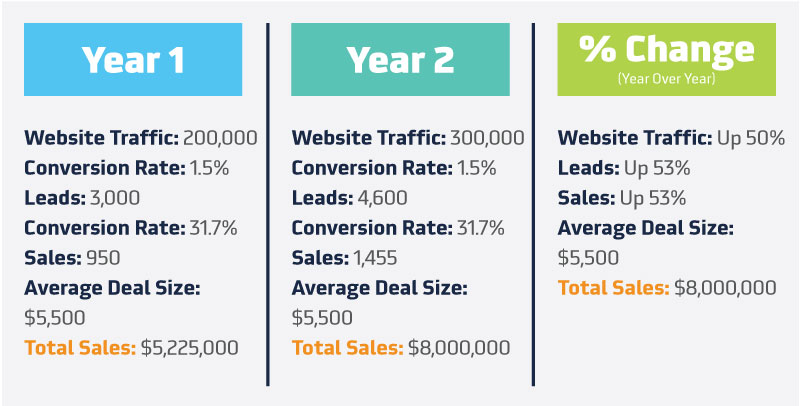
Now, this assumes the conversion rates and the deal size stay the same. Those two numbers can affect how this works out. But you see that if you are going to a 53% increase, what that means for your business. Just how much traffic you need to drive and convert to hit your goals.
Since leading indicators are a key piece to achieving goals, we created a worksheet to help you figure out these calculations yourself. Of course, if you have questions, we're here to help. We'd even be happy to meet with you to discuss your goals and what it would take to achieve them.

Don't let your goals slip away from you anymore. Take control of them with leading indicators.